Note
Click here to download the full example code
Sliced Average Variance Estimation
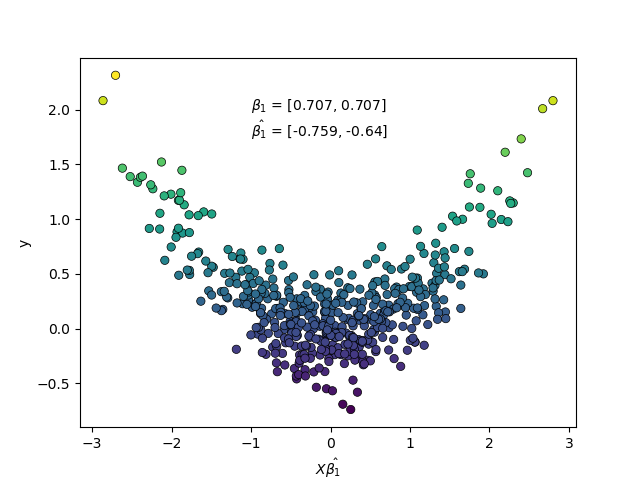
An example plot of sliced.save.SlicedAverageVarianceEstimation

import numpy as np
import matplotlib.pyplot as plt

from sliced import SlicedAverageVarianceEstimation
from sliced import datasets


X, y = datasets.make_quadratic(random_state=123)

save = SlicedAverageVarianceEstimation()
X_save = save.fit_transform(X, y)

# estimate of the first dimension reducing direction
beta1_hat = save.directions_[0, :]

plt.scatter(X_save[:, 0], y, c=y, cmap='viridis', linewidth=0.5, edgecolor='k')
plt.xlabel("$X\hat{\\beta_1}$")
plt.ylabel("y")

# annotation showing the direction found
beta_text = "$\\beta_1$ = " + "{0}".format([0.707, 0.707])
plt.annotate(beta_text, xy=(-1, 2))
beta1_hat_text = "$\hat{\\beta_1}$ = " + "{0}".format(
    np.round(beta1_hat, 3).tolist()[:2])
plt.annotate(beta1_hat_text, xy=(-1, 1.75))

plt.show()
Total running time of the script: ( 0 minutes 0.030 seconds)