Note
Click here to download the full example code
Clustering with SAVE
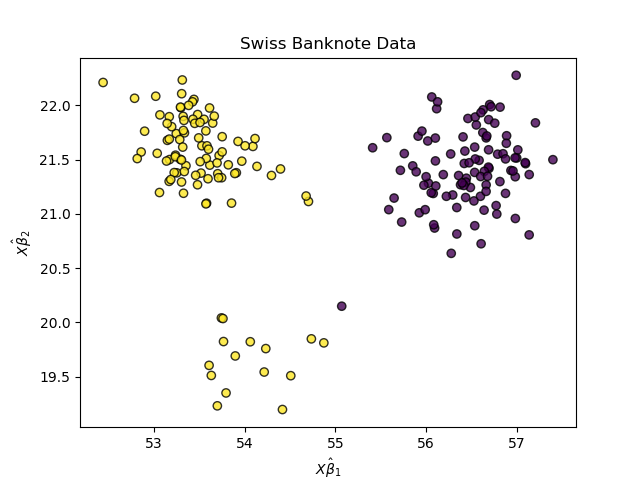
Sliced Average Variance Estimation is able to find three distinct clusters in a dataset used to classify counterfeit swiss banknotes.

import matplotlib.pyplot as plt

from sliced.datasets import load_banknote
from sliced import SlicedAverageVarianceEstimation


X, y = load_banknote()

save = SlicedAverageVarianceEstimation(n_directions=2, n_slices=2)
X_save = save.fit_transform(X, y)

plt.scatter(X_save[:, 0], X_save[:, 1], c=y, alpha=0.8, edgecolor='k')
plt.xlabel("$X\hat{\\beta}_{1}$")
plt.ylabel("$X\hat{\\beta}_{2}$")
plt.title("Swiss Banknote Data")

plt.show()
Total running time of the script: ( 0 minutes 0.029 seconds)